


Twitter is a great source of news about R — especially during conferences like useR! and RStudio Conference. And thanks to R and the rtweet package, you can build your own tool to download tweets for easy searching, sorting, and filtering. Let’s take a look, step by step.
First you want to install any of the rtweet project’s packages you don’t already have: rtweet, reactable, glue, stringr, httpuv, and dplyr. Then to start, load rtweet and dplyr.
# If you need to install any of these:
# install.packages("rtweet")
# install.packages("reactable")
# install.packages("glue")
# install.packages("stringr")
# install.packages("httpuv")
# install.packages("dplyr")
# install.packages("purrr")
library(rtweet)
library(dplyr)
Authorize the Twitter API
To use rtweet, you need a Twitter account so you can authorize rtweet to use your specific account credentials. That’s because there is a limit to how many tweets you can download in a 15-minute period.
Michael Kearney, who wrote rtweet, gives rtweet users two choices. The easiest way is to simply request some tweets. If there aren’t credentials stored on your system, a browser window should open asking you to authorize the request. After that, an authorization token will be stored in your .Renviron file so you don’t have to re-authorize in the future.
You can go to rtweet.info to see the other method, which involves setting up a Twitter developer account and a new project to generate authorization credentials. If you’re going to use rtweet a lot, you’ll probably want to do that. But to start, the easier way is, well, easier.
Import tweets
To search for tweets with a specific hashtag (or phrase that is not a hashtag), you use the intuitively named search_tweets() function. It takes several arguments, including the query, such as #rstudioconf or #rstats; whether you want to include retweets; and the number of tweets to return. The number defaults to 100.
While you can receive up to 18,000 tweets within 15 minutes, there is an important restriction when using the Twitter API to search for a word or phrase: search results only go back six to nine days unless you pay for a premium Twitter API account. Unlike the Twitter website, you can’t use rtweet to search for tweets from a conference last year. You won’t be able to search two weeks after a conference to get those tweets. So you’ll want to make sure to save tweets you pull now that you might want in the future.
There are more arguments you can use to customize your search, but let’s start with a basic search: 200 tweets with the #rstudioconf hashtag, without retweets.
tweet_df <- search_tweets("#rstudioconf", n = 200,
            include_rts = FALSE)
If you run that code and never used rtweet before, you will be asked to authorize a Twitter app.
Note that even though you ask for 200 tweets, you might get back fewer. One reason is that there may not be 200 tweets for your query in the last six to nine days. Another is that Twitter may indeed have initially extracted 200 tweets, but after filtering out retweets, fewer were left.
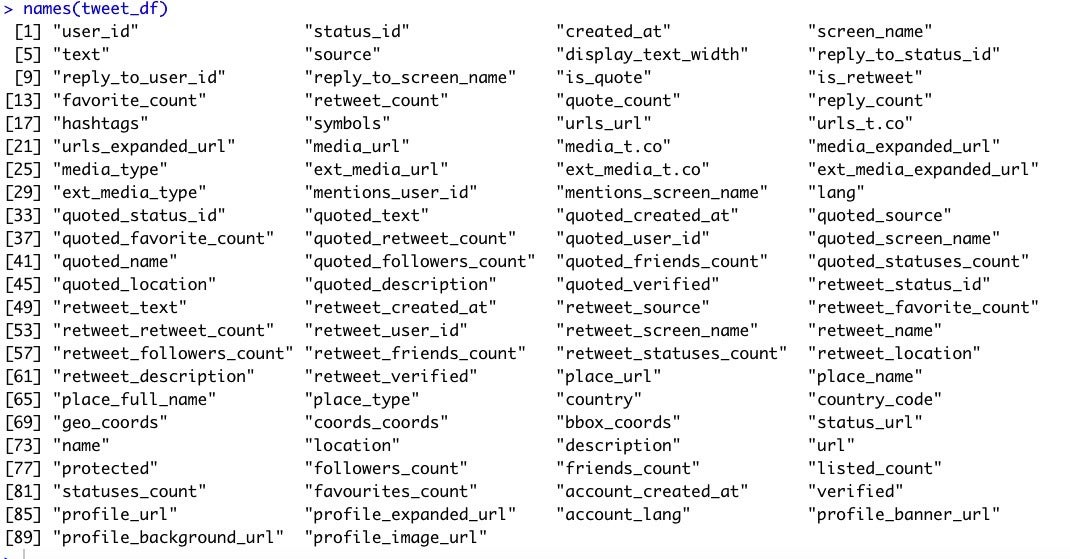
The tweet_df data frame comes back with 90 columns of data for each tweet:
 Sharon Machlis, IDG
An rtweet data frame of tweets returns with 90 columns.
The columns I’m usually most interested in are status_id, created_at, screen_name, text, favorite_count, retweet_count, and urls_expanded_url. You might want some other columns for your analysis; but for this tutorial, I’ll select just those columns.
Search, filter, and analyze your tweets
There are lots of interesting visualizations and analyses you can do with Twitter data and R. Some of them are built right into rtweet. But I’m writing this tutorial wearing my tech journalist hat. I want an easy way to see new and cool things I might not know about.
Most-liked tweets from a conference might help with that. And if I use rtweet and the Twitter API, I don’t have to rely on Twitter’s “popular” algorithm. I can do my own searches and set my own criteria for “popular.” I might want to search for top tweets just from the current day while a conference is in progress, or filter for a specific topic I’m interested in — like “shiny” or “purrr” — sorted by most likes or most retweets.
One of the easiest ways to do these kinds of searches and sorts is with a sortable table. DT is one popular package for this. But lately I’ve been experimenting with another one: reactable.
The default reactable() is kind of blah. For example:
tweet_table_data <- select(tweets, -user_id, -status_id)
library(reactable)
reactable(tweet_table_data)
This code produces a table that looks like this:
 Sharon Machlis, IDG
Default reactable table of tweets
But we can add some customizations, such as:
reactable(tweet_table_data,
          filterable = TRUE, searchable = TRUE, bordered = TRUE,
          striped = TRUE, highlight = TRUE,
          defaultPageSize = 25, showPageSizeOptions = TRUE,
          showSortable = TRUE, pageSizeOptions = c(25, 50, 75, 100, 200), defaultSortOrder = "desc",
            columns = list(
            created_at = colDef(defaultSortOrder = "asc"),
            screen_name = colDef(defaultSortOrder = "asc"),
            text = colDef(html = TRUE, minWidth = 190, resizable = TRUE),
            favorite_count = colDef(filterable = FALSE),
            retweet_count = colDef(filterable =  FALSE),
            urls_expanded_url = colDef(html = TRUE)
          )
)
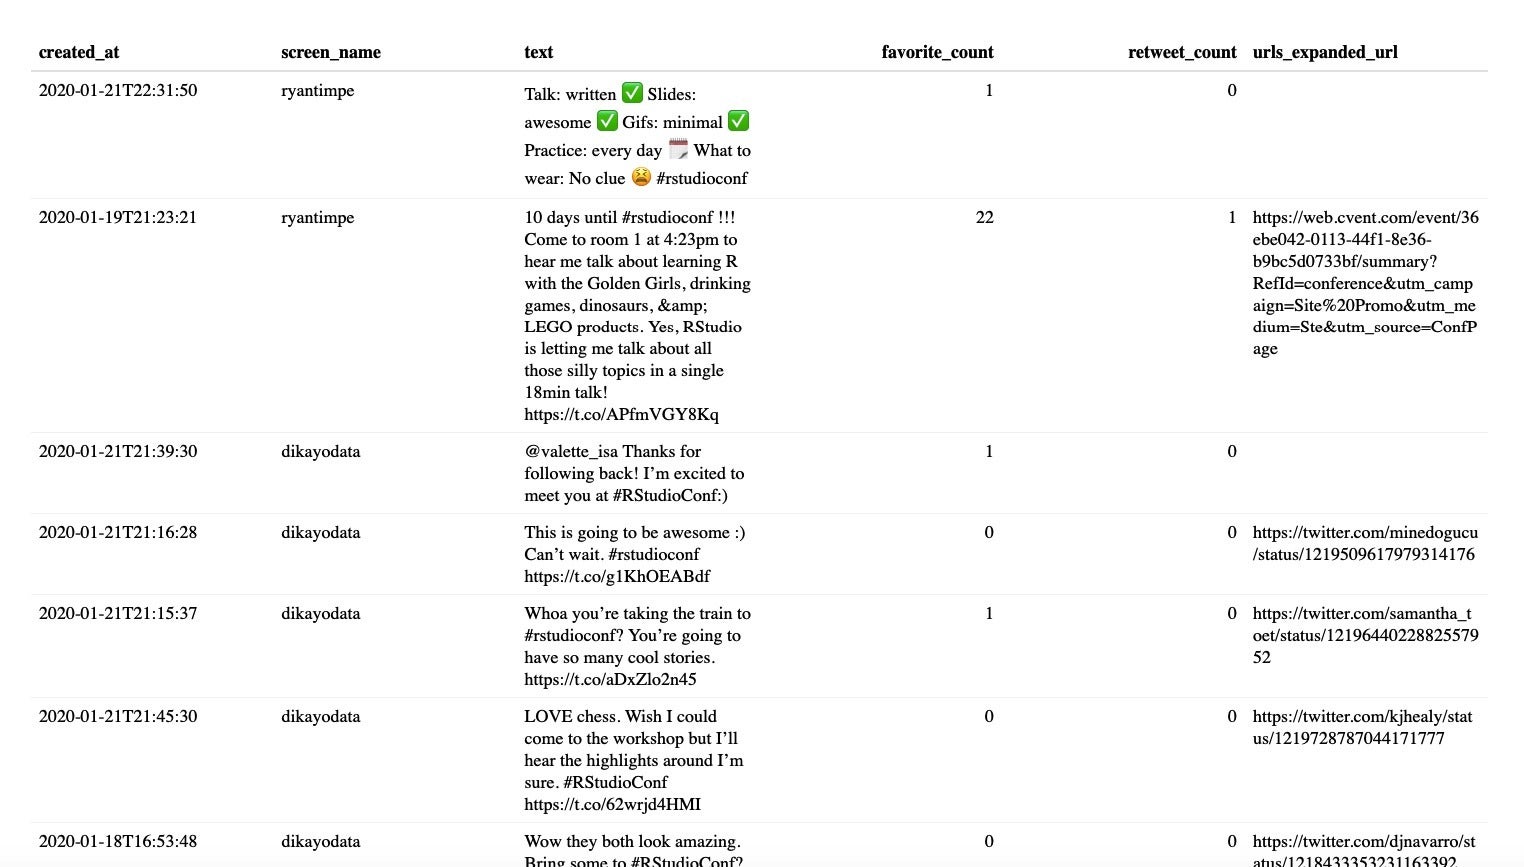
The result is a table that looks something like this:
 Sharon Machlis, IDG
A customized reactable table of tweets.
Configure your reactable data table
In the code chunk above, the filterable = TRUE argument added search filters below each column header, and searchable added the overall table search box at the top right. Turning on bordered, striped, and highlight does what you might expect: Adds a table border, adds alternating-row color “stripes,” and highlights a row if you put a cursor on it.
I set my defaultPageSize to 25. The showPageSizeOptions argument lets me change the page length interactively, and then I define page size options that will show up in a drop-down menu below the table (not visible in the screen shot). The showSortable argument adds little arrow icons next to column names so users know they can click to sort. And I set each column’s defaultSortOrder to descending instead of ascending. So if I click on the column of number of retweets or likes, I will see that as most to least, not least to most.
Finally, there is the columns argument. That’s a list containing a column definition for each column. Look at the reactable help files for more details on other available options. In this example, I set the created_at and screen_name columns to have a default sort order of ascending. For the text column, I set it to display HTML as HTML so I can add clickable links. I also set a minimum column width of 190 pixels and made the column resizable — so users can click and drag to make it wider or narrower.
I also turned off the filter boxes for favorite_count and reply_count. That’s because, unfortunately, reactable filters don’t understand when columns are numbers and will filter them as character strings. While reactable sorts number columns properly, the filter boxes are problematic. That’s the major drawback to reactable vs. the DT package: DT understands column types and filters accordingly. But sorting numerically is enough for me for this purpose.
You can check out the video at the top of this article to see what it looks like when you sort a column or make the tweet text column wider and narrower.
Make your data table more useful
A couple of things will make this table more useful. This code doesn’t display images or videos included in tweets. That’s fine, because my purpose here is to scan text, not re-create a Twitter application. But that means it will sometimes be helpful to see the original tweet in order to view photos, videos, or comments.
I think it’s convenient to add a small clickable something at the end of each tweet’s text that you can click to see the actual tweet on Twitter. I decided on >> although it could be any character or characters.
To construct a URL, I need to know the format of a tweet, which if you look at any tweet on the Twitter website, you can see is https://twitter.com/username/status/tweetID.
Using the glue package, that would be rendered like this:
glue::glue("https://twitter.com/{screen_name}/status/{status_id}")If you haven’t used glue before, it’s a great package for pasting together text and variable values. In the above code, any variable name between braces is evaluated.
My full code to create a column with a clickable link to the tweet after the tweet text:
Tweet = glue::glue("{text} <a href='https://twitter.com/{screen_name}/status/{status_id}'>>> </a>") And the code to create a data frame for an interactive table:
tweet_table_data <- tweet_df %>%
  select(user_id, status_id, created_at, screen_name, text, favorite_count, retweet_count, urls_expanded_url) %>%
  mutate(
    Tweet = glue::glue("{text} <a href='https://twitter.com/{screen_name}/status/{status_id}'>>> </a>")
    )%>%
  select(DateTime = created_at, User = screen_name, Tweet, Likes = favorite_count, RTs = retweet_count, URLs = urls_expanded_url)
I'd also like to make clickable links from the URL column, which is now just text. This is a bit complicated, because the URL column is a list column because some tweets include more than one URL.
I’m sure there is a more elegant way to create clickable links from a list column of plain-text URLs, but the code below works. First I create a function to generate the HTML if there are no URLs, one URL, or two or more:
make_url_html <- function(url) {
  if(length(url) < 2) {
    if(!is.na(url)) {
      as.character(glue("<a title = {url} target = '_new' href = '{url}'>{url}</a>") )
    } else {
      ""
    }
  } else {
    paste0(purrr::map_chr(url, ~ paste0("<a title = '", .x, "' target = '_new' href = '", .x, "'>", .x, "</a>", collapse = ", ")), collapse = ", ")
  }
}
I run purrr::map_chr() on the URL value if there are two or more URLs so that each URL gets its own HTML; then I paste them together and collapse them into a single character string to appear in the table.
Once my function works, I use purrr::map_chr() again to iterate over each item in the column:
tweet_table_data$URLs <- purrr::map_chr(tweet_table_data$URLs, make_url_html)
Don’t worry if you don’t understand this part, since it’s really more about purrr and list columns than rtweet and reactable. And it’s not necessary to search and sort the tweets; you can always click to the original tweet and see clickable links there.
Finally, I can run my customized reactable() code on the new tweet table data:
reactable(tweet_table_data,
          filterable = TRUE, searchable = TRUE, bordered = TRUE, striped = TRUE, highlight = TRUE,
          showSortable = TRUE, defaultSortOrder = "desc", defaultPageSize = 25, showPageSizeOptions = TRUE, pageSizeOptions = c(25, 50, 75, 100, 200),
          columns = list(
            DateTime = colDef(defaultSortOrder = "asc"),
            User = colDef(defaultSortOrder = "asc"),
            Tweet = colDef(html = TRUE, minWidth = 190, resizable = TRUE),
            Likes = colDef(filterable = FALSE, format = colFormat(separators = TRUE)),
            RTs = colDef(filterable =  FALSE, format = colFormat(separators = TRUE)),
            URLs = colDef(html = TRUE)
          )
)
If you’ve been following along, you should have your own interactive table that can search, sort, and filter conference or topic tweets.
Tips for tweet collectors
One thing to remember: If you’re following a conference hashtag during a conference, you will want to pull enough tweets to get the whole conference. So check the earliest date in your tweet data frame. If that date is after the conference started, request more tweets. If your conference hashtag has more than 18,000 tweets (as happened when I was tracking CES) you’ll need to come up with some strategies to get the whole set. Check out the retryonratelimit argument for search_tweets() if you want to collect a whole 18,000+ set of conference hashtag tweets going back 6 days or less
Finally, make sure to save your data to a local file when the conference ends! A week later, you’ll no longer have access to those tweets via search_tweets() and the Twitter API.
And check out the bonus “Do More with R” episode to see how to turn this Twitter tracking app into an interactive Shiny app.
For more R tips, head to the Do More With R page at https://bit.ly/domorewithR or the Do More With R playlist on the IDG TECHtalk YouTube channel.