


Interactive tables with searching and sorting can be a nice way of exploring data. And sometimes, you might want to share that data with other people — including text-only data like a list of Do More With R video tutorials.
But when that data includes a column with fairly long entries, that column may not fit well in a table the width of your screen. This can be especially tricky when not every row includes the very-wide column. For example, a table of questionnaire results where one field is “Do you have any additional comments?” Not everyone may.
That’s where a table with expandable rows can come in handy. At the NICAR data journalism conference earlier this year, I posted a form so speakers (and other attendees) could submit links to session presentations. Some people added additional comments; others didn’t. Showing that column by default would waste a lot of screen real estate.
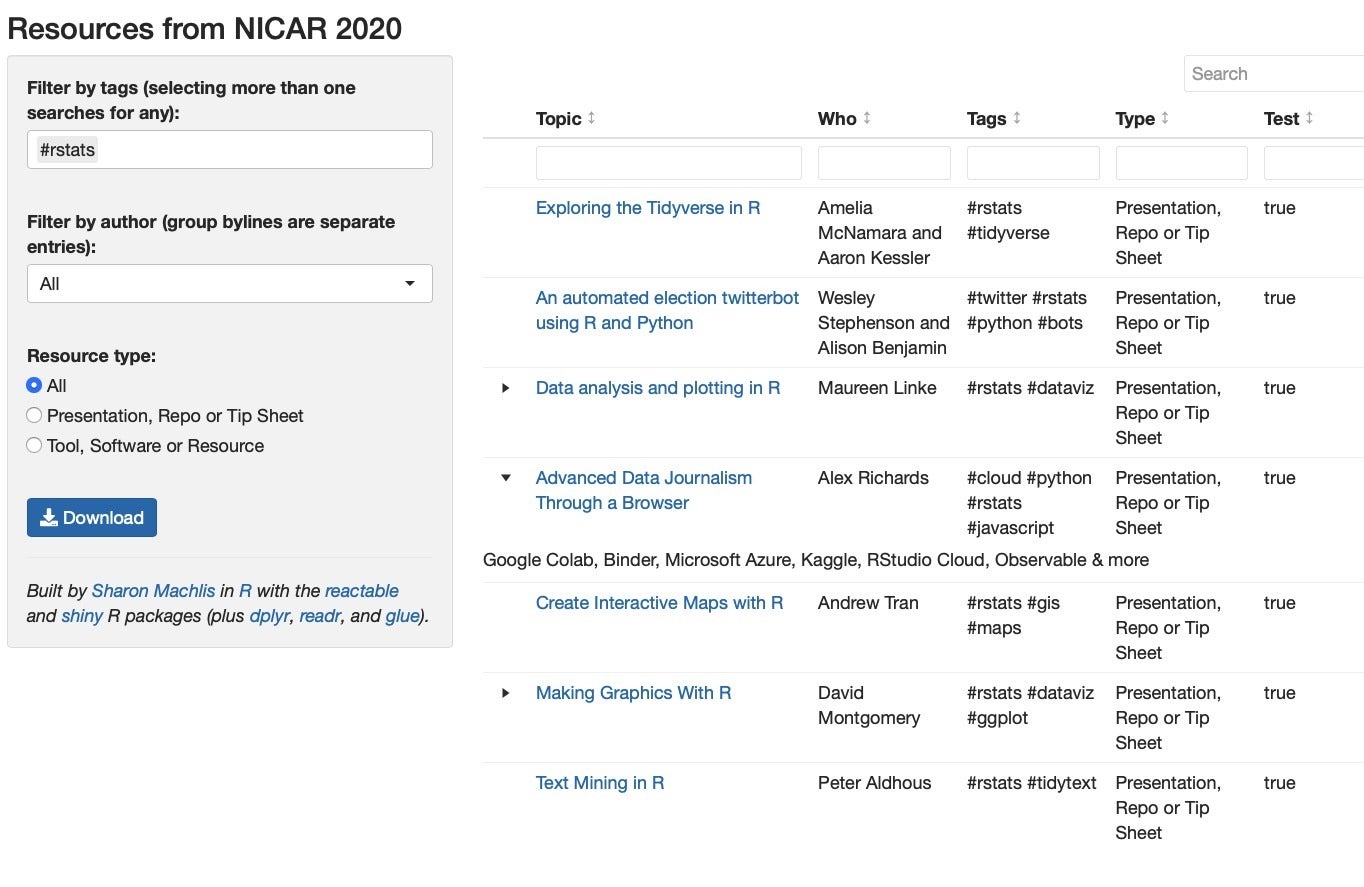
Instead, that comment field displays in my interactive table of NICAR resources only if a user clicks on the expand-row icon. Not every row can be expanded with a clickable icon at the left of the Topic name because not every row has data in that field, as you can (hopefully) see in the screenshot below.
 Sharon Machlis, IDG
R-generated table with some rows that are expandable to display more information.
Let’s see how to make a table like this.
If you’d like to follow along, install and load the reactable package. For this demo, you’ll also need the rio, glue, htmltools, and dplyr packages installed.
You can download the data I’ll use in this demo from the link below. It’s a small (15 rows) data set about R and Python sessions at this year’s NICAR conference.
Load reactable and dplyr in R
In the code below, I load reactable and dplyr and then import my data using rio::import().
library(reactable)
library(dplyr)
nicar <- rio::import("nicar.csv")
The data has columns for the name of the resource (What), the author (Who), TheURL, Tags, Type, and Comments.
Next, I want create a new column called Resource with a clickable link to each resource. I'm just writing a little basic HTML using the What and TheURL columns to make it easier for users to get to resources displayed in the table.
Then I select the columns I want in the order I want them.
nicar <- nicar %>%
  mutate(
    Resource = glue::glue("<a title = '{What}' href='{TheURL}'>{What}</a>")
  ) %>%
  select(Resource, Who, Tags, Type, Comments)
Start with a basic reactable table
Finally, I create a basic, default reactable table.
reactable(nicar)
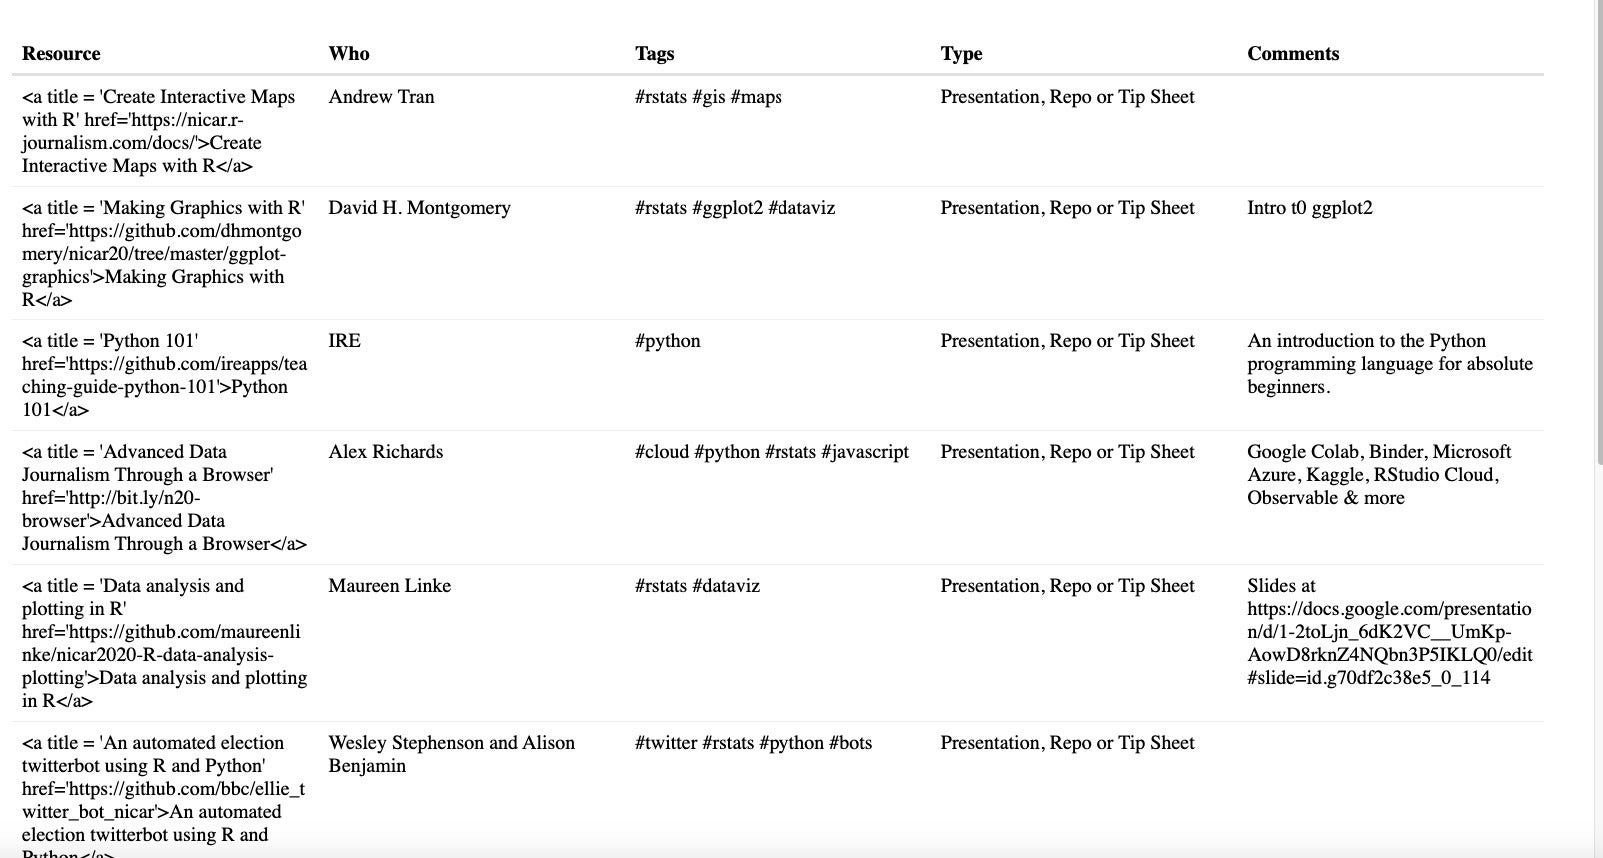
And this table is basic. There is no search box yet and the Resource column shows the actual HTML code instead of displaying as HTML.
 Sharon Machlis, IDG
Default reactable table with no search box and column displaying HTML code instead of HTML as HTML.
In the next code group, I add a search box to the table and little arrow icons showing that the columns are sortable.
reactable(nicar, searchable = TRUE, showSortable = TRUE, showSortIcon = TRUE)
To tell reactable to display the Resource column as HTML, I use the columns argument and a list where colDef sets the attributes of one or more columns. Below, I’m setting html = true for the Resource column so it displays as HTML, and I’m also making that column resizable.
reactable(nicar, searchable = TRUE, showSortable = TRUE, showSortIcon = TRUE,
          columns = list(
            Resource = colDef(html = TRUE, resizable = TRUE)
          )
)
To tell reactable not to display the Comments column in the main table, I set colDef(show = FALSE).
reactable(nicar, searchable = TRUE, showSortable = TRUE, showSortIcon = TRUE,
          columns = list(
            Resource = colDef(html = TRUE, resizable = TRUE),
            Comments = colDef(show = FALSE)
          )
)
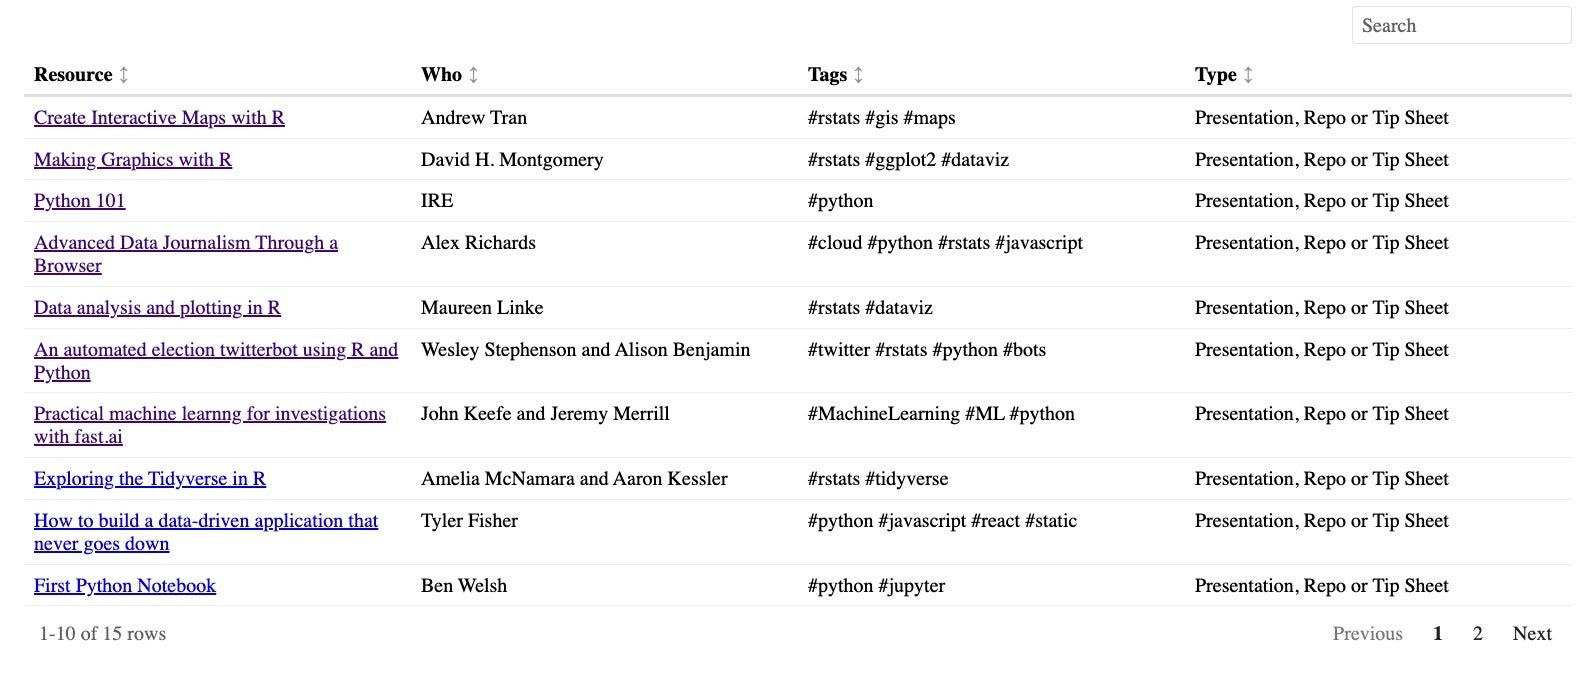
So far so good.
 Sharon Machlis, IDG
Reactable table tweaked to include a search box, one column displaying as HTML, and another column not showing in the main table.
Add reactable code for expandable rows
The next step is adding the expandable rows, and that’s a bit more complex:
# Function needed according to Greg Lin, creator of reactable
html <- function(x, inline = FALSE) {
  container <- if (inline) htmltools::span else htmltools::div
  container(dangerouslySetInnerHTML = list("__html" = x))
}
reactable(nicar, searchable = TRUE, showSortable = TRUE,
            columns = list(
              Resource = colDef(html = TRUE, resizable = TRUE),
              Comments = colDef(show = FALSE)
            ),
            # if there exists a comment, make row expandable
            details = function(index) {
              if(nicar$Comments[index] != "") {
                htmltools::tagList(
                  html(nicar$Comments[index])
                )
              }
            }
  )
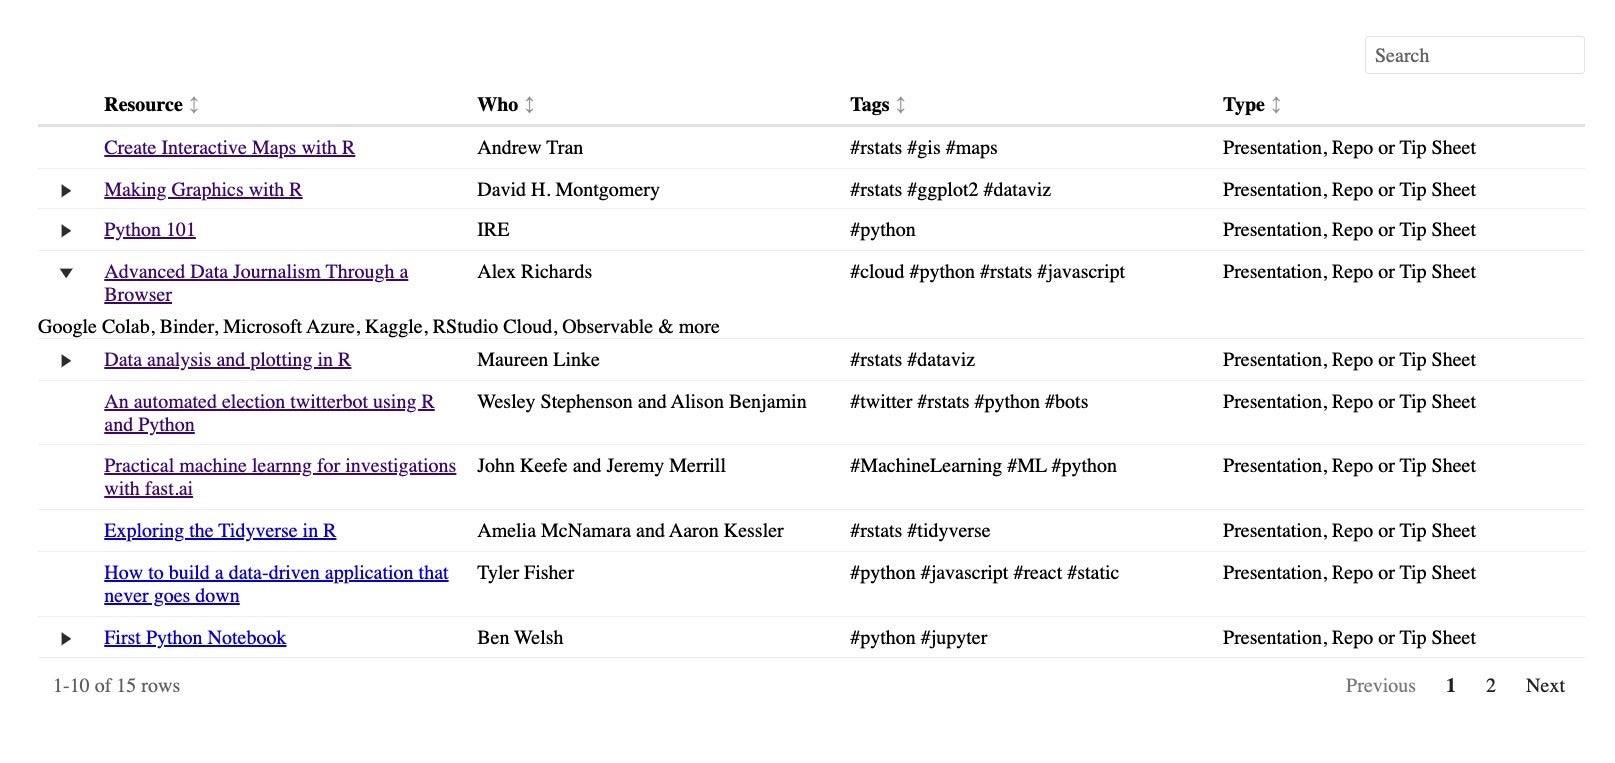
I didn’t write this part myself; reactable creator Greg Lin wrote it. Honestly, I don’t understand what every line is doing. But it works!
 Sharon Machlis
A reactable table with expandable rows.
Will I remember this code the next time I want to make a table with expandable rows? No. Definitely not. But if I make an RStudio code snippet, I don’t have to remember it. It will always be just a couple of keystrokes away.
If you’re not familiar with RStudio code snippets at all, check out the for a full explainer. But here are the basics.
Make an RStudio code snippet
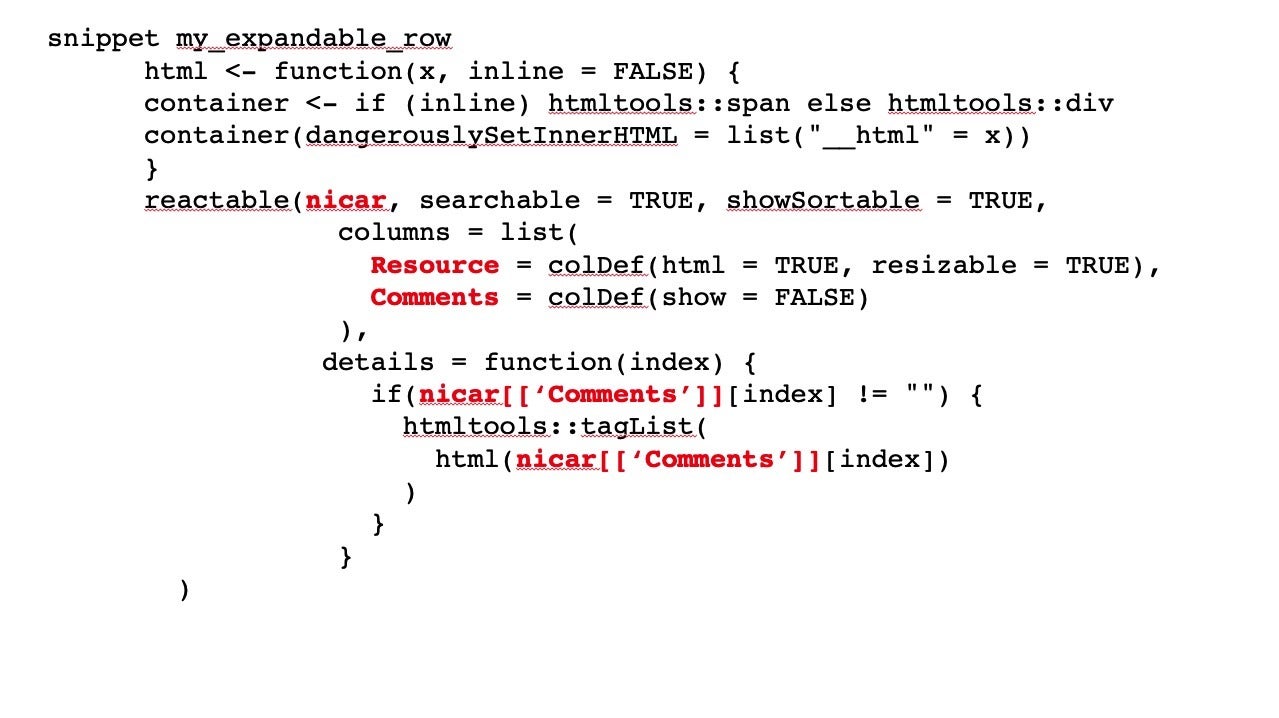
Below is an image of my table code highlighting the variables for my data frame and column names, as well as changing the column definition from dollar sign notation to bracket notation (which works a lot better in snippets). Also — very important — I added a snippet title and indented every line of code with a starting tab. That’s a must!
 Sharon Machlis, IDG
Code for my table with variables highlighted, column syntax changed to bracket notations, and snippet title and indentation added.
Then I just need to change each variable name to a generic snippet variable: 1 for the data frame, 2 for the column I want to display as HTML, and 3 for the expandable-row column. Note the variable syntax: ${number:variable_name}. These variables will make it easy for me to fill in actual variable names back in RStudio.
snippet my_expandable_row
	html <- function(x, inline = FALSE) {
	  container <- if (inline) htmltools::span else htmltools::div
	  container(dangerouslySetInnerHTML = list("__html" = x))
	}
	reactable(${1:mydf}, searchable = TRUE, showSortable = TRUE,
	            columns = list(
	              ${2:html_column} = colDef(html = TRUE, resizable = TRUE),
	              ${3:expand_col} = colDef(show = FALSE)
	            ),
	           details = function(index) {
	              if(${1:mydf}[['${3:expand_col}']][index] != "") {
	                htmltools::tagList(
	                  html(${1:mydf}[['${3:expand_col}']][index])
	                )
	              }
	            }
	  )
You can copy and paste the snippet code above into your own RStudio snippets file using
usethis::edit_rstudio_snippets()
to open the snippets file in RStudio. Make sure the snippet code quotes are plain quotes and that each line is indented with a tab (not just spaces; a starting tab for each line of code is mandatory).
Now if you type the name of the snippet in an RStudio source R script file, it should expand to give you the code. You can then type the name of the first variable, hit tab, type the name of your second variable, and so on. Check out the video embedded in this article to see how this works. And enjoy your own interactive tables with expandable rows!
For more R tips, head to the InfoWorld Do More With R page.