BenchmarkDotNet is a lightweight, open source, powerful .NET library that can transform your methods into benchmarks, track those methods, and then provide insights into the performance data captured. It is easy to write BenchmarkDotNet benchmarks and the results of the benchmarking process are user friendly as well.
You can take advantage of BenchmarkDotNet to benchmark both .NET Framework and .NET Core applications. In this article we’ll explore how we can work with BenchmarkDotNet in .NET Core. You can find BenchmarkDotNet on GitHub.
To work with the code examples provided in this article, you should have Visual Studio 2019 installed in your system. If you don’t already have a copy, you can download Visual Studio 2019 here.
Create a console application project in Visual Studio
First off, let’s create a .NET Core console application project in Visual Studio. Assuming Visual Studio 2019 is installed in your system, follow the steps outlined below to create a new .NET Core console application project in Visual Studio.
- Launch the Visual Studio IDE.
- Click on “Create new project.”
- In the “Create new project” window, select “Console App (.NET Core)” from the list of templates displayed.
- Click Next.
- In the “Configure your new project” window shown next, specify the name and location for the new project.
- Click Create.
This will create a new .NET Core console application project in Visual Studio 2019.
Note that when you create the console application project, the resulting Program class (generated automatically in the Program.cs file) will look like this:
class Program
{
   static void Main(string[] args)
  {
      Console.WriteLine("Hello World!");
  }
}
We’ll use this project and Program class to work with BenchmarkDotNet in the subsequent sections of this article.
Install the BenchmarkDotNet NuGet package
To work with BenchmarkDotNet you must install the BenchmarkDotNet package. You can do this either via the NuGet Package Manager inside the Visual Studio 2019 IDE, or by executing the following command at the NuGet Package Manager Console:
Install-Package BenchmarkDotNet
Why benchmark code?
A benchmark is a measurement or a set of measurements related to the performance of a piece of code in an application. Benchmarking code is essential to understanding the performance metrics of the methods in your application. It is always a good approach to have the metrics at hand when you’re optimizing code. It is very important for us to know if the changes made in the code has improved or worsened the performance. Benchmarking also helps you to narrow in on the portions of the code in the application that need refactoring.
Steps for benchmarking code using BenchmarkDotNet
To run BenchmarkDotNet in your .NET Framework or .NET Core application you must follow these steps:
- Add the necessary NuGet package
- Add Benchmark attributes to your methods
- Create a BenchmarkRunner instance
- Run the application in Release mode
Create a benchmarking class in .NET Core
Open the Program.cs file and write the following code in there.
  [MemoryDiagnoser]
   public class MemoryBenchmarkerDemo
    {
        int NumberOfItems = 100000;
        [Benchmark]
        public string ConcatStringsUsingStringBuilder()
        {
            var sb = new StringBuilder();
            for (int i = 0; i < NumberOfItems; i++)
            {
                sb.Append("Hello World!" + i);
            }
            return sb.ToString();
        }
        [Benchmark]
        public string ConcatStringsUsingGenericList()
        {
            var list = new List<string>(NumberOfItems);
            for (int i = 0; i < NumberOfItems; i++)
            {
                list.Add("Hello World!" + i);
            }
            return list.ToString();
        }
    }
The above program illustrates how you can write methods for benchmarking. Note the usage of the Benchmark attribute on top of each of the methods that are to be benchmarked.
In the Main method of the Program.cs file you must specify the initial starting point — the BenchmarkRunner class. This is a way of informing BenchmarkDotNet to run benchmarks on the class specified. So, replace the default code of the Main method in the Program.cs file using the following code snippet.
static void Main(string[] args)
{
   var summary = BenchmarkRunner.Run<MemoryBenchmarkerDemo>();
}
Run the benchmark in your .NET Core application
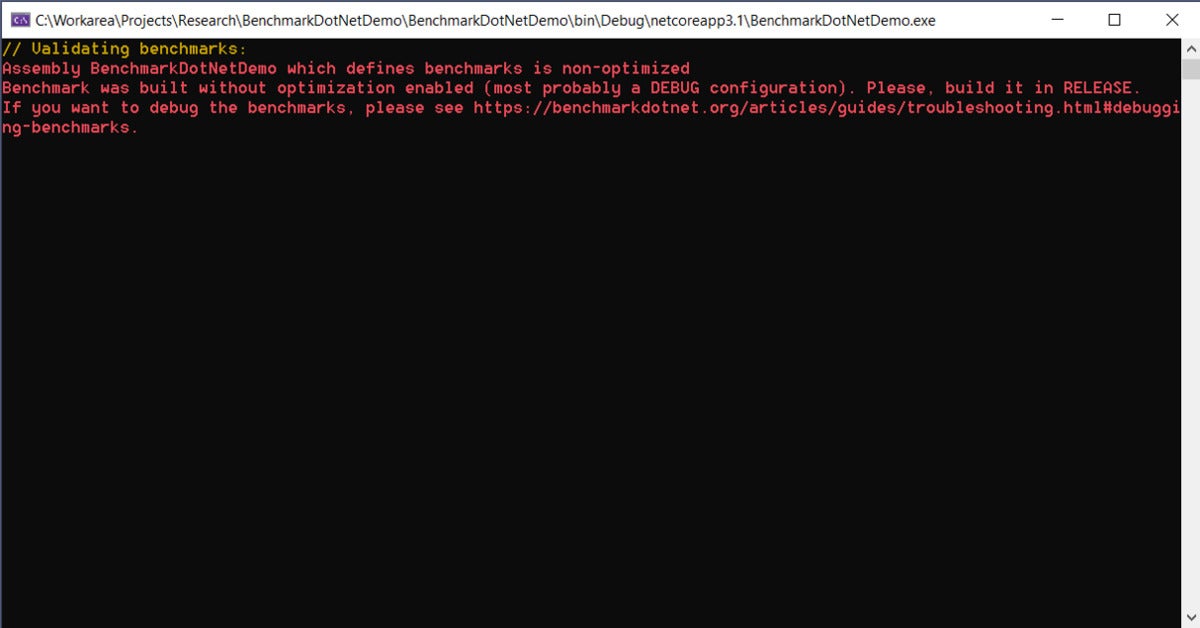
If you run the application in debug mode, here’s the error message you’ll see:
 IDG
IDG
Figure 1. Running benchmark code in debug mode will result in an error.
When benchmarking you should always ensure that you run your project in release mode. The reason is that during compilation the code is optimized differently for both debug and release modes. The C# compiler does a few optimizations in release mode that are not available in debug mode.
Hence you should run your project in the release mode only. To run benchmarking, specify the following command at the Visual Studio command prompt.
dotnet run -p BenchmarkDotNetDemo.csproj -c Release
For best results, you should make sure that all applications are closed and all unnecessary processes stopped prior to running benchmarks.
Note that if you don’t specify the configuration parameter then the runtime will attempt to do benchmarking on non-optimized, debug-mode code. And you’ll be presented with the same error shown in Figure 1.
Analyze the benchmarking results
Once the execution of the benchmarking process is complete, a summary of the results will be displayed at the console window. The summary section contains information related to the environment in which the benchmarks were executed, such as the BenchmarkDotNet version, operating system, computer hardware, .NET version, compiler information, and information related to the performance of the application.
A few files will also be created in the BenchmarkDotNet.Artifacts folder under the application’s root folder. Here is a summary of the results.
 IDG
IDG
Figure 2. Summary of BenchmarkDotNet benchmark results.
As evident from the summary shown in Figure 2, for each benchmarked method, you will see a row of data that specifies the performance metrics such as mean execution time, Gen 0, Gen 1, Gen 2 collections, etc.
On examining the results shown in Figure 3, you can see that the ConcatStringUsingGenericList is much faster than the ConcatStringUsingStringBuilder method. You can also see that there are many more allocations after running the ConcatStringUsingStringBuilder method.
 IDG
IDG
Figure 3. Another view of BenchmarkDotNet benchmark results.
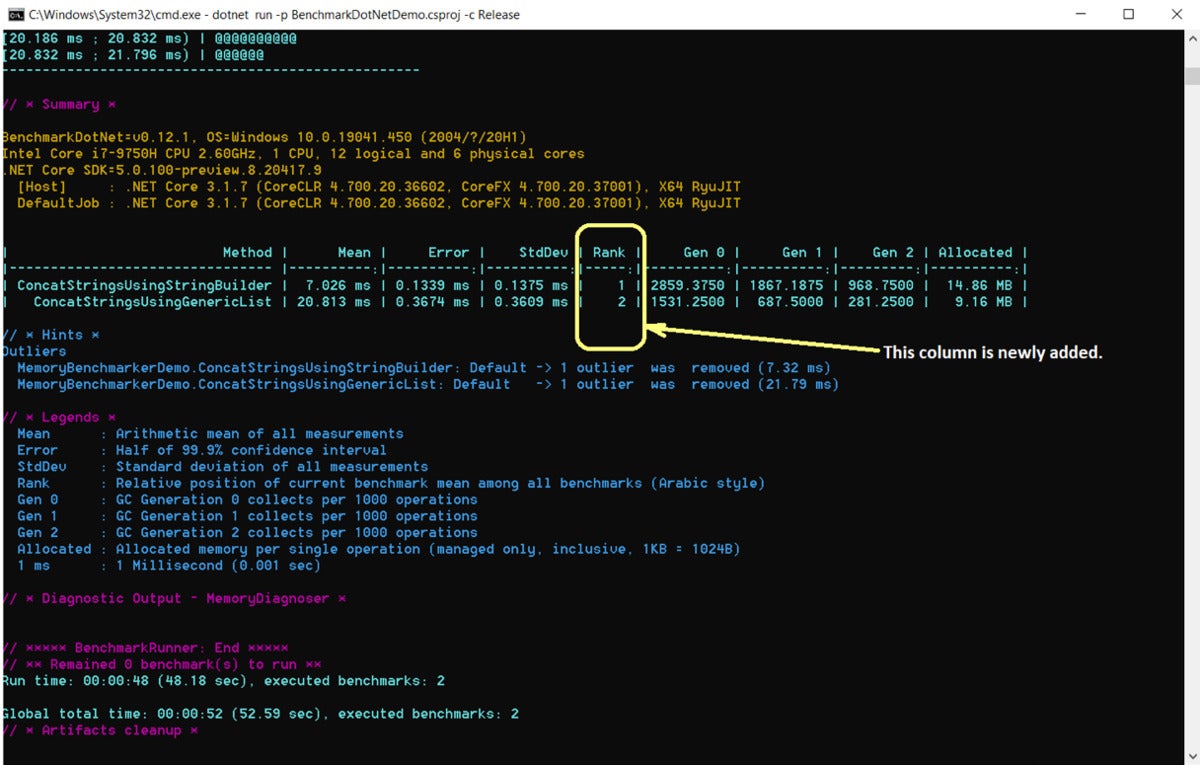
Now add the RankColumn attribute on top of the MemoryBenchmarkerDemo class. This will add an extra column to the output indicating which method was faster. Run the benchmarking process again using the following command.
dotnet run -p BenchmarkDotNetDemo.csproj -c Release
When you run this command, the benchmarking process kicks off and displays the output after the benchmarking process has been executed successfully. Figure 4 below shows the output with RankColumn added.
 IDG
IDG
Figure 4. BenchmarkDotNet benchmark results including the RankColumn attribute.
BenchmarkDotNet is a nice tool that provides a simple way to make an informed decision about the performance metrics of your application. In BenchmarkDotNet, invocation of a method that has the Benchmark attribute set is known as an operation. An iteration is the name given to a collection of several operations.
You can explore a demo ASP.NET Core application that illustrates several ways to benchmark the code. You can get the application from the ASP.NET repo on GitHub.
How to do more in C#:
- How to unit test static methods in C#
- How to refactor God objects in C#
- How to use ValueTask in C#
- How to use immutability in C
- How to use const, readonly, and static in C#
- How to use data annotations in C#
- How to work with GUIDs in C# 8
- When to use an abstract class vs. interface in C#
- How to work with AutoMapper in C#
- How to use lambda expressions in C#
- How to work with Action, Func, and Predicate delegates in C#
- How to work with delegates in C#
- How to implement a simple logger in C#
- How to work with attributes in C#
- How to work with log4net in C#
- How to implement the repository design pattern in C#
- How to work with reflection in C#
- How to work with filesystemwatcher in C#
- How to perform lazy initialization in C#
- How to work with MSMQ in C#
- How to work with extension methods in C#
- How to us lambda expressions in C#
- When to use the volatile keyword in C#
- How to use the yield keyword in C#
- How to implement polymorphism in C#
- How to build your own task scheduler in C#
- How to work with RabbitMQ in C#
- How to work with a tuple in C#
- Exploring virtual and abstract methods in C#
- How to use the Dapper ORM in C#
- How to use the flyweight design pattern in C#


