


Analyzing a data frame by column is one of R’s great strengths. But what if you’re a Tidyverse user and you want to run a function across multiple columns?
As of dplyr 1.0, there will be a new function for this: across(). Let’s take a look.
When this article was published, dplyr 1.0 wasn’t yet available on CRAN. However, you can get access to all the new functions by downloading the development version of dplyr with this command:
remotes::install_github("tidyverse/dplyr")For this demonstration, I’ll use some data showing COVID-19 spread: USA Facts’ confirmed U.S. cases by day and county. If you want to follow along, you can find out more about the data at https://usafacts.org/visualizations/coronavirus-covid-19-spread-map/ and download the CSV file here. The USA Facts data is freely available under a Creative Commons license, as long as you credit USA Facts in any published work (as I just have done).
I’ll load in the dplyr and readr packages with
library(dplyr)
library(readr)
Please remember, I’m loading the development version of dplyr; this won’t work yet with the CRAN version.
Next, I’ll read in the file I downloaded (I named the file covid19_cases_by_county.csv; yours may be named something else).
cases <- read_csv("covid19_cases_by_county.csv")If we view the data frame structure with head(cases), we’ll see that each county is a row and each date is a column. This is not a tidy data set, but it does work as a good example for using across().
 Sharon Machlis, IDG
Initial un-tidy data frame structure.
Next, I’m going to subset the data for just New York State in March and April, to make results easier to see. I’ll do that by filtering for state equals NY, and column names starting with 3 or 4.
ny <- filter(cases, State == "NY") %>%
  select(County = `County Name`, starts_with(c("3", "4")))
Typically, if I wanted to get the total for each day, I’d either reshape the data or use a package like janitor to add a total row. But if I wanted a separate summary data frame in this format, I can now use across().
So what is across()? I think of it as “perform a function on each column, one column at a time.” It lets you do this without having to name every column one by one or use a purrr() map function.
Here’s what the code looks like for ”give me the sum of every numeric column in this data frame.”
daily_totals <- ny %>%
  summarize(
    across(is.numeric, sum)
  )
The first argument of across() should be the data frame, but that’s taken care of with daily_totals <- ny %>% at the top. The first argument here in across() is the columns to operate on. That takes any dplyr::select() syntax. I also could have given a range of columns instead of is.numeric, such as
daily_totals <- ny %>%
  summarize(
    across(2:ncol(ny), sum)
  )
Or, I could use starts_with().
daily_totals <- ny %>%
  summarize(
    across(starts_with("4"), sum)
  )
across() allows for multiple functions to be run on each column using similar code. For example, what if I want to see the maximum and median for each day? If I create a list of named functions, I can apply every function in the list at once.
Below is code that creates a list median_and_max with two functions. One, med, is the median (removing any missing values); the other, max, is for maximum, again removing missing values.
median_and_max <- list(
  med = ~median(.x, na.rm = TRUE),
  max = ~max(.x, na.rm = TRUE)
)
Notice that defining each named function requires a ~ tilde sign.
Below is the code to run each function in the list on all April columns:
april_median_and_max <- ny %>%
  summarize(
    across(starts_with("4"), median_and_max)
  )
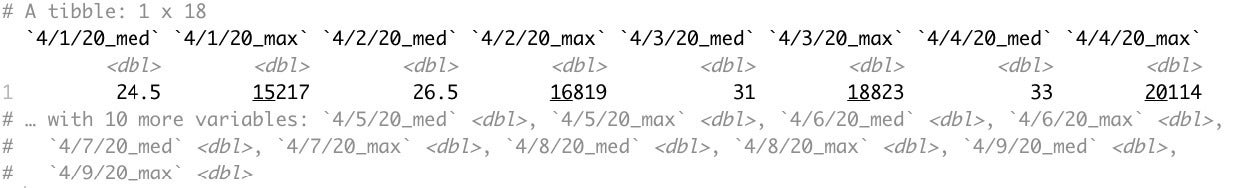
The result: Each date column now has two columns! ... one with median and the other with max.
 Sharon Machlis, IDG
Result of running across() with a named list of multiple functions.
That is not the tidiest of data formats, but we live in a world where people sometimes want what they feel are more human-readable structures. Now, you can generate column-based results like this with no data reshaping required.
For more on the new across() function, check out the Tidyverse blog post — and a second post about using across() by row with rowwise(). And for more R tips, head to the InfoWorld Do More With R page!